The hottest locations of 2021

Let’s face it — every residential market in New Zealand was hot during 2021. But which markets were the hottest? The latest QV Quartile Index shows just how quickly first-home values have risen across the country this year.
With December’s figures still yet to be finalised, the biggest gains in first-home values across the main centres over the 11 months from 1 January to 30 November 2021 occurred in Papakura (41%), Christchurch (37.7%), Franklin (33.7%), Napier (30.2%), and New Plymouth (30%).
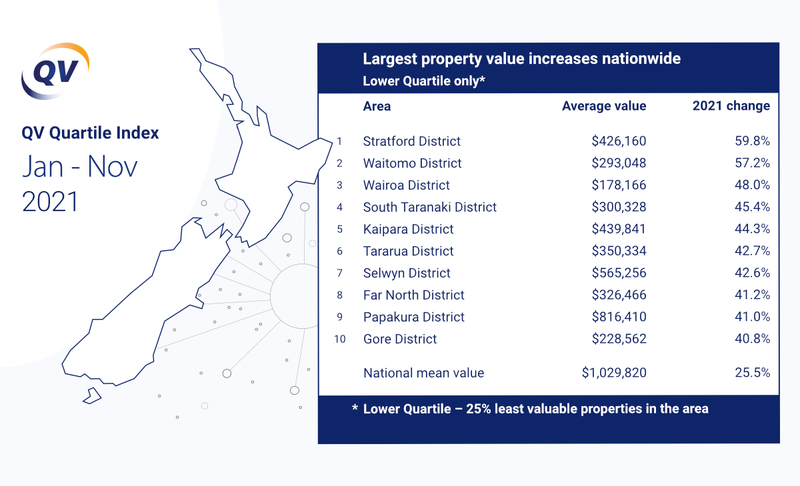
Outside of New Zealand’s main centres, first-home values increased by an even greater percentage in Stratford (59.8%), Waitomo (57.2%), Wairoa (48%), South Taranaki (45.4%), and Kaipara (44.3%) — all districts that boast average home values well below the national average.
QV spokesperson Simon Petersen commented: “No matter how you slice the data, 2021 has been an absolutely bumper year for New Zealand’s residential property market. We all thought 2020 was a big year, and yet values increased by less than half as much on average as they have this year.”

"2021 has certainly been action-packed. We’ve seen the return of loan to value ratios, rapidly rising debt-to-income ratios, high inflation, low-but-rising interest rates, and a raft of significant tax changes designed to take some of the steam out of the market. Just about the only thing we haven’t seen this year is significant drops in home values.”
Although Mr Petersen didn’t expect to see significant drops next year either, QV’s latest figures demonstrated a substantial shift in momentum from the 25% most affordable homes, the ones typically targeted by first-home buyers and investors in the lower quartile, to the 25% most expensive houses in the upper quartile.
In the eight months leading into spring, first-home values increased at an average rate of 6.8% per month across NZ’s main centres, slightly higher than the average rate of growth in the upper quartile (6.6%). Since September, that rate of growth has slowed to 5.9%, while upper quartile properties have increased in value at an average rate of 8.8%.
“This spring swing from entry-level properties to the far more expensive homes at the top of the property ladder suggests that rising interest rates and affordability constraints are starting to bite first-home buyers, who will be finding things even more difficult right now. As a consequence, that section of the market is slowing, while people further up the ladder will still be able to use the sizeable gains they’ve made over the last year to trade their way up.”
“I’d expect to see this trend continue next year, with interest rates highly likely to rise further, making things even more difficult for first-home buyers in the foreseeable future,” Mr Petersen added.

He said Auckland was a prime example of this shift in price pressure from the bottom of the property ladder to the top, with entry-level home values increasing by an average rate of 5.9% in the November quarter, compared to 9.4% in the upper quartile.
It was a similar story in Wellington, where the region’s most expensive house values increased at a far greater rate than their more affordable counterparts this quarter — often dramatically so. In Hutt City, for example, entry-level home values went up by less than half as much as their most expensive counterparts in the last three months.
Even in one of NZ’s most affordable housing markets, Invercargill, the rate of first-home value growth has gradually declined from a 2021 peak of 13.5% in the three-months to March, to just 1.4% in the most recent quarter. Meanwhile, the value of the city’s most expensive houses increased by 6.7% over the same period.
The only main centre where the rate of first-home value growth has not trended downward as the year has gone on is Christchurch, which hit an annual high growth rate of 15.3% in the three months to November 2021.
“Although we haven’t yet seen any impact in Christchurch from the tightening of lending, the increase in the OCR, and rising mortgage interest rates, that will likely change in 2022,” Mr Petersen added. “I have a feeling we’re not going to see another year quite like 2021 again.”
Keep track of all these value movements and more via our interactive QV House Price Index.


