Latest QV Quartile Index shows increasing price pressure at the top of the market
Property sellers are banking sizeable capital gains in Queenstown and Auckland as increased price pressure comes on the top of New Zealand residential property market.
The latest QV Quartile Index, which tracks residential property prices and sales at the upper and lower ends of the market, shows the biggest capital gains this quarter in dollar terms were in Queenstown, where the average house price in the upper quartile increased by $206,431 in just three months.
In second and third place were Auckland’s Rodney district and Auckland’s central suburbs, where the average house price in the upper quartile increased by $199,475 and $199,246 respectively.

Quotable Value (QV) general manager David Nagel commented: “In just three months, the most expensive houses in these parts of Auckland and in Queenstown have made more than twice as much as the average Kiwi household will in a year. It’s an absolutely huge amount of money and just another example of how overheated our residential property market has become.
“We tend to spend so much time focussing on the lower-end of the market, the first-home buyers and investors, that sometimes it’s easy to lose sight of the market as a whole. The people in the upper quartile of the market are just as vulnerable to a market correction as anyone else – and possibly even more so.”
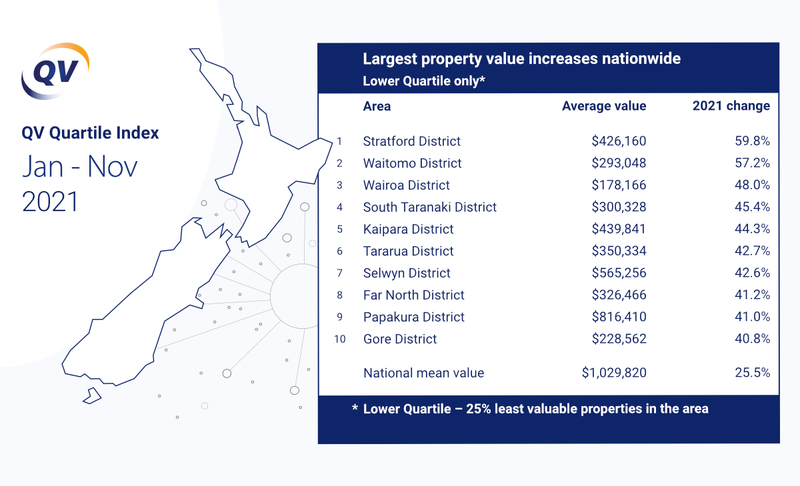
But the largest house price rises as a percentage were at the upper quartile in the larger Wellington region – in Upper Hutt (14.4%) and on the Kapiti Coast (13.2%) – and at the lower quartile level in Invercargill (12.5%).
“While we’re still generally seeing more sales activity occurring in the lower quartile of the market overall – in the price bracket typically targeted by first-home buyers and investors – it appears that the upward pressure on house prices is actually most being reflected at the top of the market, in the upper quartile,” Mr Nagel added.

In Queenstown, there were 19% more sales at the lower end of the market this quarter than at the top. Other than that, Mr Nagel said there wasn’t any huge gulfs between upper- and lower-quartile sales volumes across much of the country – though he did expect activity in the lower quartile to “possibly taper off” as loan-to-value ratios (LVRs) took hold.
Christchurch was the largest urban centre in the country where there was more activity at the upper end of the market than at the lower end, but the same was also true of Napier, Hastings, New Plymouth, Palmerston North, and Nelson.
“Now that we’ve established this baseline of activity across the entire country, it’ll be very interesting to map out the effect of this week’s suite of policy changes, announced on Tuesday, will have on the market in next month’s QV Quartile Index and the ones after that,” said Mr Nagel.
“There is still plenty of competition between first-home buyers and investors, but with the extension to the bright line test from 5 to 10 years, as well as the changes to interest deductibility for property investors, we’ll likely see a swing toward first-home buyers in the coming months.”


