Latest Reserve Bank figures on household debt to income ratios show more mortgage money being borrowed at in excess of five times annual income - but Auckland may be reaching limits
By David Hargreaves

Around the country, house buyers are still borrowing ever higher amounts relative to their incomes, but Auckland may be reaching some sort of limit, a crunch of the latest Reserve Bank figures on residential mortgage lending by debt-to-income ratio (DTI) shows.
The RBNZ has been publishing detailed information on mortgages by DTI for only about three and a half years.
While what you might regard as a 'high' DTI is subjective, the RBNZ monitors closely borrowing that is five times or more annual income.
What the trend in the monthly, but published quarterly, series has shown is that DTIs were at fairly elevated levels in 2017, but then dropped fairly markedly in 2018.
However, since then it has generally been onwards and upwards - particularly for the first home buyers (FHBs).
And that is again the situation with the latest figures if we look at the picture nationally.
Auckland hits the ceiling?
However, there's some sign that the Auckland DTIs, which were already much higher than those in the rest of the country due to Auckland's much higher prices on average - are maybe hitting some kind of ceiling. Whether such a 'ceiling' might be a natural one as to the natural limits of what people can afford - or is being imposed by the banks - is not clear from the figures.
'Ceiling' or not though, the Auckland figures are at high levels.
As mentioned, the RBNZ compiles these DTI figures monthly but publishes them quarterly. So, what I've done here is focus on the figures for September 2020 (the latest month) and compared them with June 2020 and also September 2019.
I've looked closely at the DTI ratios by amounts of money borrowed, though also have cast my eye on DTIs by number of mortgage applications.
The table below shows the percentage of new mortgage money with debt-to-income ratios of over five times:
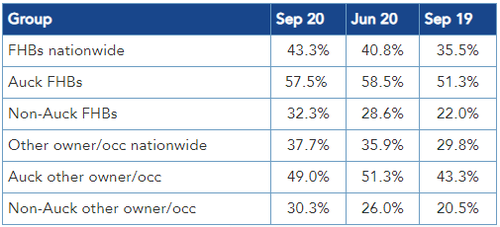
So, talking to the figures in that table, we can see that the FHBs borrowing mortgages at DTIs above five have, nationwide, really blown out in the past year, with now 43.3% of FHB mortgage money (just over $600 million) borrowed at a DTI of over five as of September, up from 40.8% in June and just 35.5% (which equated to $345 million) as at September 2019.
In terms of the Auckland FHBs - well they are borrowing eye watering amounts, but now maybe a limit is being reached, albeit at a stratospheric level. As the table shows, 57.5% of new mortgage money borrowed by Auckland FHBs in September was at a DTI of over five. But this is down from the 58.5% in June. In September 2019 it was 51.3%.
If we look at non-Auckland FHBs, well that's onward and upward, from lower levels. The amount of non-Auckland FHB new mortgage money at a DTI of above five was just 22% in September 2019, but had moved up to 28.6% by June 2020 and has gone further, to 32.3% as of September 2020.
A similar trend (as can be seen from the table) can be observed from the figures for other owner-occupiers as well. This again shows the Auckland figures seemingly plateauing at high levels while the figures in the rest of the country are moving up quite quickly.
Looking at the numbers
The figures for mortgages by actual number (as opposed to dollar amount) show similar trends - albeit the percentage figures are not as high.
For example in September 2020 FHBs around the country took up 3046 new mortgages, of which 1100 (36.1%) were at a DTI of over five. This percentage figure was up from 33.6% in June and 28.3% in September 2019. Again the Auckland figures are much higher, but have plateaued, with 53.7% of Auckland FHB mortgages in September 2020 (526 by number) at a DTI above five. This is down from 55.9% in June but up on the 49.3% in September 2019.
But again, outside of Auckland, it is still onwards and upwards for the high DTI lending, with 574 FHBs (27.8% of the total) taking up mortgages at at DTI above five in September, up from 24.3% in June and just 17.9% in September a year ago.
What sort of levels would the RBNZ be happy with? It will undoubtedly be closely watching these stats.
As we know, the RBNZ last week signalled reintroduction of high loan to value ratio (LVR) limits.
The RBNZ has long been enthusiastic about having some kind of DTI control measure available (though not for immediate use) in its 'macro-prudential toolkit' - along with the LVRs. The current upward trend in borrowing at high DTIs is presumably only reinforcing that. The issue of a possible DTI measure is included in the ongoing review of Reserve Bank legislation.
This story was originally published on Interest.co.nz and has been republished here with permission.


